Interactive Gantt View
Schedule a Demo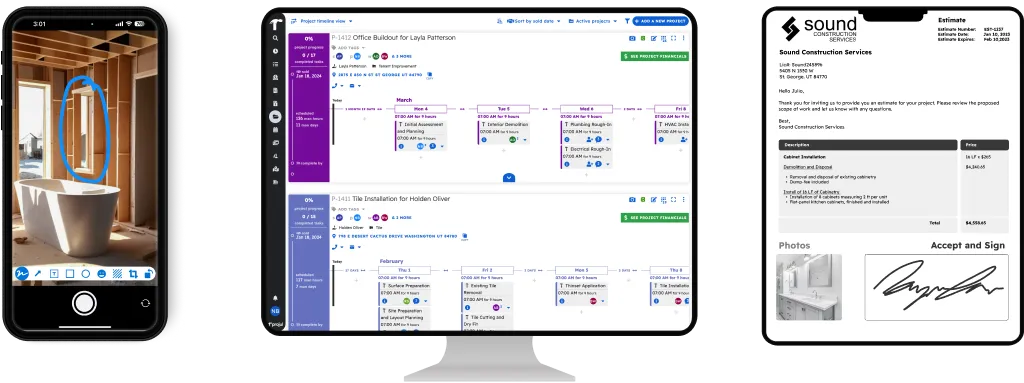
What Is a Gantt Chart in Construction?
If you’ve ever tried to schedule a construction project on a whiteboard or a basic calendar, you know the pain. Tasks overlap, dependencies get missed, and when one thing moves, nobody updates the rest. A construction Gantt chart fixes that.
Projul’s interactive Gantt view gives contractors a drag-and-drop visual timeline with task dependencies that automatically adjust when schedules shift. Slide entire project timelines to a new start date and keep every crew on track. Projul offers flat-rate pricing with no per-user fees for construction companies of all sizes.
A Gantt chart is a visual timeline where every task has a start date, end date, and duration shown as a horizontal bar. The real power is in the dependencies. You can link tasks together so that when framing gets pushed back, drywall, electrical, and paint all shift automatically.
In Projul, the Gantt view gives you a bird’s-eye view of your entire project schedule. You see what’s happening now, what’s coming next, and where your schedule has problems, all on one screen.
Why Whiteboards and Spreadsheets Fall Apart
Most contractors start with a whiteboard in the office or a spreadsheet on their laptop. It works for a while. Then you’re running three projects at once and your schedule lives in five different places.
Here’s what goes wrong with whiteboard and spreadsheet scheduling:
Nothing is connected. When you move a task on a whiteboard, nothing else updates. The drywall crew still shows up on the original date because nobody told them framing got pushed. You end up with a crew on site and nothing for them to do.
Your field team can’t see it. A whiteboard schedule is only useful if you’re standing in front of it. Your superintendent is on a job site 40 minutes away. Your sub is waiting for a text that never comes. The schedule exists, but nobody who needs it can actually access it.
Spreadsheets don’t show relationships. You can list tasks and dates in Excel, but you can’t see at a glance that electrical rough-in depends on framing completion. When one task slips, you have to manually trace every downstream impact. On a 50-task project, that takes an hour. On a 200-task project, good luck.
Updates don’t happen. Be honest: how often does your whiteboard schedule actually match reality by week three of a project? Schedules that are hard to update don’t get updated. Then they become fiction, and your team stops trusting them.
Projul’s Gantt view solves every one of these problems. It’s visual, it’s connected, it’s accessible from anywhere, and it takes two seconds to update. So your team actually keeps it current.
Why Drag-and-Drop Scheduling Matters
Most contractor scheduling tools make you click through forms to change a date. That’s slow and frustrating when you’re reworking a schedule because of weather, material delays, or a sub who can’t show up.
Projul’s Gantt view is drag-and-drop. Grab a task, slide it to a new date, and every linked task adjusts automatically. It’s the same motion as moving an appointment on your phone’s calendar. No forms, no pop-ups, no wasted time.
This matters because construction schedules change constantly. If it takes 5 minutes to move one task, you’ll never keep your schedule current. If it takes 2 seconds, you actually will.
Over 5,000 contractors use Projul’s drag-and-drop Gantt to keep their schedules accurate without spending half the day in front of a computer.
Multiple Views for Different Needs
Not everyone on your team thinks about schedules the same way. Your project manager wants to see task dependencies across the whole project. Your field super wants to know what’s happening this week. Your office manager wants a calendar view to track deadlines.
Projul gives you multiple ways to look at the same schedule:
Gantt view shows every task as a bar on a timeline with dependency lines connecting them. This is your planning view. Use it when you’re building the schedule, checking for conflicts, and making sure the sequence of work makes sense.
Calendar view shows tasks laid out on a daily, weekly, or monthly calendar. This is your execution view. Use it when you need a quick answer to “what’s happening today?” or “what’s due this week?”
List view shows tasks in a simple list format with dates, assignments, and status. This is your detail view. Use it when you need to filter, sort, or search for specific tasks across a project.
All three views pull from the same data. Change something in the Gantt, and it updates in the calendar and list instantly. Your team uses whichever view makes the most sense for their role, and everyone stays on the same page.
Gantt Task Rescheduling and Linking
When one task depends on another, use the Projul Gantt view to link them and manage the dependency. Link framing to drywall. Link drywall to paint. When you slide the first task, everything downstream moves with it.
This is where Projul’s Gantt view saves you the most time. On a typical residential remodel, you might have 40 to 60 tasks with a web of dependencies. Moving one task by hand means tracing every connection and updating every downstream date. With Projul, you drag one bar and the rest follows.
Projul’s contractor scheduling Gantt also lets you:
- Add, edit, and delete tasks right from the timeline
- Attach photos and files to tasks from the Gantt view
- View and contact assigned workers, project managers, or clients with one tap
- Apply project templates or clone projects straight from this view
- Set task durations and let Projul calculate end dates automatically
- Color-code tasks by trade, phase, or priority for quick visual scanning
When you slide a project schedule, Projul automatically adjusts all linked dependencies relative to their parent tasks. Your schedule stays realistic instead of falling apart the moment something changes.
How General Contractors Use the Gantt to Coordinate Trades
If you’re a GC running multiple subs on a project, the Gantt view becomes your coordination hub. Here’s how contractors use it every day:
Sequence the trades correctly. Lay out your schedule so each trade follows the right order. Foundation, framing, rough plumbing, rough electrical, insulation, drywall, finish work. The Gantt makes the sequence visible so nothing gets scheduled out of order.
Spot conflicts before they happen. When you can see that the electrician and the plumber are both scheduled for the same week in the same space, you fix it before two crews show up and get in each other’s way.
Communicate the plan to subs. Instead of calling each sub to tell them their start date, share the schedule through Projul. Subs see exactly when they’re needed and what has to finish before they start. Fewer phone calls, fewer surprises.
Handle delays without chaos. Rain washes out Tuesday and Wednesday. Open the Gantt, slide the affected tasks, and every downstream trade shifts automatically. Send the updated schedule to all your subs in one step. What used to take an hour of phone calls now takes 30 seconds.
Track progress visually. As tasks get completed, the Gantt shows you exactly where the project stands. You can see at a glance if you’re on schedule, ahead, or falling behind. That’s information you need to make decisions, not just data that sits in a report.
Resource Allocation and Crew Management
Scheduling isn’t just about when tasks happen. It’s about who does them. Projul’s Gantt view ties into crew assignments so you can see which workers are assigned to which tasks and spot overallocation before it causes problems.
If your best framing crew is booked on two projects the same week, the Gantt makes that obvious. You catch it in the planning stage instead of finding out on Monday morning when someone doesn’t show up.
Assign specific crew members or teams to tasks directly from the Gantt. When you move a task, the assignment stays with it. Your crew gets notified through Projul’s notification system so they always know where they’re supposed to be.
Real-Time Updates From the Field
A schedule is only useful if it reflects reality. Projul’s Gantt view updates in real time as your field team logs progress, completes tasks, and adds notes from the job site.
When your superintendent marks a task as complete on their phone, the Gantt updates immediately. When a task runs long and the end date gets pushed, downstream dependencies adjust. You’re always looking at the current state of the project, not last week’s plan.
This is the difference between a living schedule and a dead document. Whiteboards and spreadsheets show you what you hoped would happen. Projul’s Gantt shows you what’s actually happening.
Full Gantt Access on Every Device
Projul’s Gantt view runs on your phone, tablet, and desktop. All versions are optimized from the ground up, not a shrunken-down desktop version crammed onto a small screen.
Over 5,000 contractors use Projul to manage schedules from the field without waiting to get back to the office. Check task status from the cab of your truck. Reschedule a task while you’re on the phone with a sub. Update progress before you leave the job site.
Projul is rated 9.8 out of 10 on G2 for ease of use. Your crew picks it up fast because the Gantt works the way they already think about schedules.
Slide Schedules Without Losing Your Mind
When rain or delays push things back, use project sliding to shift your entire Gantt schedule in seconds. Pick a new start date and every linked task moves together. Your crew gets notified automatically through Projul’s notification system.
No more spending an hour manually adjusting every task after a delay. One move and you’re done. On a project with 100 tasks and a week-long weather delay, that’s the difference between 5 seconds of work and an entire afternoon of rescheduling.
Your Gantt Connects to the Whole Project
The Gantt view ties into scheduling and project management so everything you see on the timeline matches what your team sees on their task lists. One source of truth, no conflicting schedules.
Your budget, time tracking, and task assignments all connect back to the same schedule. When something moves on the Gantt, it moves everywhere. That means your project manager, your field super, and your accounting team are all working from the same information.
Why Gantt Charts Work Better Than Whiteboards for Construction
Let’s be real. That whiteboard in your office has done a lot of heavy lifting over the years. You’ve drawn out timelines, scribbled trade names, and erased things so many times the board has a permanent gray smudge. It got the job done when you were running one or two projects. But as your company grows, the whiteboard doesn’t grow with you.
A Gantt chart does everything your whiteboard does, except it does it better, faster, and from anywhere. Here’s why contractors who make the switch don’t look back.
You Can See the Whole Project in One View
A whiteboard has physical limits. You run out of space. You start abbreviating task names. You cram four weeks of work into two feet of board because you didn’t plan the layout well enough. By the end, it looks like a conspiracy theory wall and only you can read it.
A Gantt chart in Projul gives you the full timeline on one screen. Zoom out to see the whole project from start to finish. Zoom in to see the details of a specific week. Scroll left and right through the timeline without losing context. There’s no running out of space. A 6-month project with 200 tasks fits just as cleanly as a 2-week punch list.
When you’re sitting in a meeting with your client or your bank, you can pull up the Gantt on your laptop and show them exactly where things stand. Try doing that with a photo of your whiteboard taken at an angle with bad lighting.
Dependencies Are Visible at a Glance
Here’s the biggest thing a whiteboard can’t do: show you how tasks are connected. You can write “framing” and “drywall” next to each other, but there’s nothing on that board telling you that drywall literally cannot start until framing passes inspection.
On a Gantt chart, dependency arrows make those connections obvious. You see a line running from framing to drywall, from drywall to paint, from rough plumbing to fixtures. When you look at the chart, you instantly know what has to happen before what. You’re not holding the project logic in your head anymore - it’s right there on the screen.
This matters because the average residential remodel has somewhere between 40 and 80 tasks, and most of them depend on something else finishing first. Keeping all of that in your head works until it doesn’t. And when it doesn’t, you’ve got a plumber showing up to a house that still doesn’t have walls.
Drag-and-Drop Rescheduling vs. Erasing and Redrawing
This is where the Gantt chart really pulls ahead. On a whiteboard, rescheduling means grabbing the eraser, wiping out half the board, and redrawing everything by hand. If you’re lucky, you remembered where everything was supposed to go. If you’re not, you just lost 20 minutes trying to reconstruct last week’s plan.
In Projul’s Gantt view, you grab a task bar and drag it to the new date. That’s it. Every task linked to it slides automatically. What took 20 minutes on the whiteboard takes 2 seconds on the Gantt. And you didn’t accidentally erase something important in the process.
Construction schedules change constantly. Material is backordered. The inspector can’t come until Thursday. Your framing crew got pulled to an emergency job. Every one of those changes means rescheduling, and if rescheduling is painful, it doesn’t happen. Your whiteboard schedule becomes fiction by week two, and your team stops looking at it.
With a Gantt, rescheduling is so fast and easy that you actually do it. Your schedule stays accurate because keeping it accurate costs you almost nothing in time or effort.
Your Team Can Actually See It
The whiteboard schedule only exists in one place: your office. Your superintendent is on the other side of town. Your subs are scattered across three job sites. Nobody can see the whiteboard unless they drive to your office and stand in front of it.
A Gantt chart in Projul lives in the cloud. Your super checks it from the job site on their phone. Your electrician sees when they’re needed without a phone call. Your office manager checks deadlines from their desk. Everyone is looking at the same schedule, updated in real time, no matter where they are.
That’s not a small thing. A schedule that nobody can see is the same as no schedule at all. And a schedule that everyone can see keeps the whole project moving because people know what’s expected and when.
Accountability Built Into the Chart
A whiteboard doesn’t track who changed what or when. Somebody erased Tuesday’s tasks and moved them to Thursday, and now nobody knows who did it or why. There’s no record. There’s no history.
Projul’s Gantt view keeps a record of changes. You can see what moved, when it moved, and what triggered the change. That’s not about playing blame games - it’s about understanding your project history so you can make better decisions next time.
When you’re reviewing a project post-completion and trying to figure out why the timeline slipped by three weeks, your whiteboard has nothing to tell you. Your Gantt chart has the full story.
Reading Your Gantt Chart: A Contractor’s Quick Guide
If you’ve never used a Gantt chart before, it can look like a mess of colored bars and lines. But once you know what you’re looking at, it’s one of the simplest scheduling tools out there. Here’s a plain-language breakdown of everything on the screen.
Bars = How Long a Task Takes
Every task on your Gantt chart shows up as a horizontal bar. The left edge of the bar is the start date. The right edge is the end date. The wider the bar, the longer the task takes.
A bar that stretches from Monday to Friday means that task is scheduled for a full work week. A thin bar that barely covers one day is a quick task. You can see at a glance which parts of your project are the long, drawn-out phases and which ones are quick hits.
In Projul, you can color-code these bars by trade, phase, or priority. So all your plumbing tasks are blue, all your electrical tasks are yellow, and all your high-priority items are red. One look at the chart and you know what kind of work is happening during any given week.
Arrows = What Depends on What
The arrows (or lines) connecting bars are dependencies. They show you which tasks have to finish before other tasks can start.
Think of it like this: you can’t hang drywall until framing is done and inspected. So there’s an arrow from the “framing inspection” bar to the “hang drywall” bar. That arrow means Projul knows the relationship between those two tasks. If framing gets pushed back, drywall moves automatically.
There are a few types of dependencies, but the most common one in construction is “finish-to-start.” Task A has to finish before Task B can start. That covers about 90% of construction scheduling. Framing finishes, then drywall starts. Rough electrical finishes, then insulation starts. Foundation cures, then framing starts.
You don’t need to memorize dependency types. In Projul, you just link two tasks together by clicking on them, and the software handles the rest. The arrow shows you the connection. If you need to break a connection or change it, that’s a couple of clicks too.
Milestones = Key Deadlines and Inspections
Not every item on your schedule is a multi-day task. Some are single moments that matter - your foundation inspection, your certificate of occupancy, the day the client moves in. These show up as milestones on the Gantt chart.
A milestone is usually shown as a diamond shape or a special marker on the timeline. It doesn’t have a duration because it’s a point in time, not a range. But it’s connected to your other tasks through dependencies just like everything else.
Milestones are perfect for:
- Inspections. Rough plumbing inspection, framing inspection, final inspection. Put them on the Gantt as milestones so you always know when they’re coming and what has to be done before they happen.
- Client deadlines. The client needs to move in by June 15th. Put that on the Gantt. Now you can visually see whether your schedule actually supports that date or whether you need to have a conversation.
- Material deliveries. The trusses are arriving on the 12th. Mark it as a milestone so everyone knows, and link it as a dependency to whatever task needs those trusses.
- Permit approvals. You can’t start certain work until the permit comes through. A milestone for “permit approved” linked to the dependent tasks keeps your schedule honest.
The Critical Path = What Determines Your Finish Date
This is the most important concept on your Gantt chart, and it’s simpler than it sounds. The critical path is the longest chain of dependent tasks from the start of your project to the end. It’s the sequence of work that directly determines when you finish.
Here’s an example. Say you have two parallel tracks of work:
- Track 1: Excavation (3 days) to Foundation (5 days) to Framing (10 days) to Roofing (4 days) = 22 days
- Track 2: Site prep (2 days) to Utility hookups (3 days) = 5 days
Track 1 is your critical path because it takes 22 days. Track 2 only takes 5 days. If the utility hookup gets delayed by 2 days, your project still finishes on time because Track 2 has 17 days of breathing room. But if framing gets delayed by even 1 day, your whole project finishes 1 day late because framing is on the critical path.
Why does this matter? Because it tells you where to focus your attention. Tasks on the critical path have zero room for slipping. Tasks off the critical path have some flexibility. When you’re deciding which fire to put out first, the critical path gives you the answer.
In Projul’s Gantt view, you can identify your critical path by looking at the longest chain of connected tasks. If something on that chain is at risk, that’s your top priority. Everything else can wait.
Percent Complete = Where You Actually Stand
As your team marks tasks as in progress or done, the Gantt bars fill in to show how much of each task is complete. A bar that’s half filled means the task is about 50% done. A fully filled bar means it’s complete.
This gives you a quick visual of project progress without digging into reports. Scan the Gantt from left to right. Are the bars near today’s date mostly filled? You’re on track. Are there empty bars behind today’s date? You’re falling behind and need to address it.
It’s the fastest way to answer the question every client asks: “How’s my project going?”
How to Use Gantt Charts to Manage Subcontractor Schedules
If you’re a general contractor, your subs are the engine that drives your project. But coordinating 8 to 12 different subcontractors on a single job is one of the hardest parts of the business. Who’s coming when? What has to be done before they arrive? What happens when one sub runs late and it ripples through everyone else?
The Gantt chart is the best tool for managing all of this. Here’s how to use it.
Assigning Subs to Tasks
Every task on your Gantt chart can be assigned to a specific subcontractor or crew. In Projul, you do this right from the Gantt view. Click on a task, assign the sub, and their name shows up on the bar.
Now when you look at the chart, you don’t just see a list of tasks - you see who’s responsible for each one. Scan down the chart and you can immediately tell which subs are on site during any given week.
This is especially powerful when you’re scheduling multiple subs in tight sequences. You need the plumber in and out before the electrician starts. You need the insulation crew to finish before the drywall hangers arrive. Assigning subs to tasks on the Gantt lets you see the handoffs clearly and make sure nobody is stepping on anyone else’s toes.
Seeing Conflicts Before They Happen
Here’s where the Gantt chart saves you from the most common scheduling headaches. When you lay out your tasks visually with subs assigned, conflicts jump off the screen.
Maybe you’ve got your HVAC sub scheduled to start ductwork on the same day your framing crew is still finishing that section of the house. On a spreadsheet, that’s two rows with the same date and you might not catch it. On a Gantt chart, it’s two overlapping bars with a dependency arrow that tells you something is wrong.
Or maybe your electrician is booked on two of your projects the same week. When both projects are in Projul, you can see the overlap instantly. You call the electrician on Tuesday instead of finding out on Monday morning that they’re at the other job site.
The rule is simple: problems you catch during planning cost you almost nothing. Problems you catch on the job site cost you time, money, and relationships. The Gantt chart helps you catch them during planning.
Sharing the Visual Schedule With Your Subs
One of the biggest sources of frustration in construction is communication breakdowns with subs. They didn’t know framing was behind. They thought they were starting Monday. Nobody told them the schedule changed.
Projul makes it easy to share the schedule with your subs so everyone sees the same picture. Your subs can log into Projul and see exactly when their tasks are scheduled, what has to happen before they start, and whether anything upstream has shifted.
When you drag a task on the Gantt and the electrician’s start date moves from Tuesday to Thursday, the electrician gets notified. They don’t show up on Tuesday to find the house isn’t ready for them. They come on Thursday when the work is actually there.
This cuts down on one of the most expensive problems in construction: crews on site with nothing to do, or crews not on site when you need them. Both of those cost you money. Both of them are preventable with a shared, visual schedule.
Handling the Domino Effect When a Sub Runs Late
Every GC knows the feeling. The concrete sub was supposed to be done Friday. It’s now Wednesday of the following week and they’re still finishing up. Every trade behind them just shifted, and you’ve got six phone calls to make.
With project sliding and linked dependencies in the Gantt, handling this takes seconds instead of hours. Slide the concrete task to its actual completion date. Watch every downstream task adjust automatically. The framing crew’s start date moves. The inspector’s date moves. The electrician’s date moves. All of it happens in one drag-and-drop motion.
Then Projul notifies the affected subs automatically. Instead of six phone calls, you make zero. Everyone gets the updated schedule on their phone. They adjust their own plans accordingly. You just saved an hour of phone tag and prevented three confused subs from showing up on the wrong day.
Planning Around Sub Availability
Your subs are juggling their own schedules across multiple GCs and projects. The best ones are booked weeks or months in advance. When you’re building your Gantt chart, you need to account for their availability.
In Projul, when you assign a sub to a task and set the dates, you’re creating a commitment that both of you can see. If you know your tile guy can’t start until the week of the 15th, you schedule the task accordingly and build the rest of the Gantt around that constraint.
This is the difference between a schedule that’s built on reality and one that’s built on hope. The Gantt forces you to think through every handoff, every dependency, and every sub’s availability before work starts. That planning pays off every single day of the project.
Interactive Gantt vs Static Schedules: What Changes Everything
A lot of contractors have tried Gantt charts before - in Excel, in PDF printouts from a GC, or in some generic project management app that wasn’t built for construction. If your experience with Gantt charts has been frustrating, that’s probably because you were using a static Gantt. There’s a massive difference between a static schedule and an interactive one.
Drag a Task and Watch Everything Downstream Adjust
This is the single biggest difference. A static Gantt chart - whether it’s a printout, a PDF, or an Excel bar chart - is a picture. It shows you the schedule as it was when someone created it. The moment anything changes, that picture is wrong.
An interactive Gantt in Projul is alive. Grab a task, drag it to a new date, and every connected task recalculates instantly. If you move framing back by three days, drywall moves back by three days. Painting moves back. Final inspection moves back. You see the ripple effect in real time, right on the screen, before you even let go of the mouse.
This changes how you think about scheduling. Instead of treating the schedule as something you create once and pray holds up, you treat it as a living tool you adjust constantly. Because adjusting it is effortless, you actually do it. Your schedule stays accurate, your team trusts it, and your projects run better.
Zoom From Week to Month to Full Project
Static schedules are locked to one view. If someone printed your schedule at the monthly level, you can’t drill into a specific week without getting a new printout. If your spreadsheet shows the day-by-day breakdown, you can’t zoom out to see the big picture.
Projul’s interactive Gantt lets you zoom in and out freely. Need to see the next two weeks in detail? Zoom in. Need to check whether you’ll hit the client’s move-in date four months from now? Zoom out. You’re always one scroll or one pinch away from the view you need.
On a phone, you pinch and zoom just like you would on a map. On a desktop, you use the zoom controls or your scroll wheel. The point is that the same chart serves you at every altitude - from the 10,000-foot project overview down to the ground-level daily task list.
Filter by Crew, Trade, or Phase
When your Gantt chart has 150 tasks on it, you don’t always want to look at all 150. Sometimes you just want to see what the plumbing crew is doing this month. Or you want to look at only the rough-in phase. Or you need to check what’s assigned to a specific crew member.
Projul lets you filter the Gantt so you see only what matters right now. Filter by trade and you get a Gantt chart that shows just the electrical work, or just the HVAC, or just the site work. Filter by phase and you see just the foundation phase, or just the finish phase. Filter by crew and you see what one team is doing across the project.
This makes the Gantt practical even on very large projects. A 300-task commercial build looks overwhelming when you see everything at once. Filter it down to your scope of work for this week, and it’s perfectly manageable.
Real-Time Collaboration, Not a Document You Email Around
Static schedules are documents. Someone creates them, exports them as a PDF, and emails them to the team. By the time the team opens the PDF, it might already be out of date. And when the schedule changes, someone has to create a new version and email it again. Version control becomes a nightmare. Which PDF is current? The one from Tuesday or the one from Thursday?
Projul’s interactive Gantt is always current because there’s only one version. Everyone looks at the same schedule in real time. When the project manager drags a task to a new date at 8 AM, the superintendent sees the change on their phone at 8:01 AM. No PDFs, no emails, no version confusion.
This is especially important when you’re coordinating with multiple aspects of project management - budgets, time tracking, change orders, and communication all tie back to the same schedule. When the schedule changes in the Gantt, it changes everywhere. One source of truth, always up to date.
The Schedule Actually Gets Used
Here’s the real difference between interactive and static, and it’s not a software feature. It’s a human behavior thing.
Static schedules don’t get used because they’re too hard to maintain. Creating one takes a long time. Updating it takes almost as long. So people create the schedule at the beginning of the project, it falls out of date within a week, and everyone goes back to managing things by phone, text, and gut instinct.
Interactive schedules get used because they’re easy to maintain. Creating one takes minutes with Projul’s templates. Updating it takes seconds with drag-and-drop. So people actually keep the schedule current, which means people actually look at it, which means people actually follow it.
The best schedule in the world is useless if nobody looks at it. The simplest schedule in the world is priceless if everyone follows it. Projul’s interactive Gantt sits firmly in the second category. It’s simple enough that your crew actually uses it every day, and that daily use is what keeps your projects on track.
Stop Guessing, Start Scheduling
Whether you’re a residential contractor or a commercial contractor, construction scheduling doesn’t have to be a mess of whiteboards, phone calls, and outdated spreadsheets. Projul’s interactive Gantt view gives you a visual, connected, real-time schedule that your whole team can access from anywhere.
Over 5,000 contractors use Projul to keep their projects on track. At $4,788/year with no per-user fees, your entire team gets access to the Gantt view, the calendar, the list view, and everything else in Projul. No extra charge for your field crews, your subs, or your office staff.
See why contractors rate Projul 9.8 out of 10 on G2 for ease of use. Your schedule should be a tool that helps you build, not a chore that keeps you at a desk.


