Reporting that Makes You Money
Schedule a Demo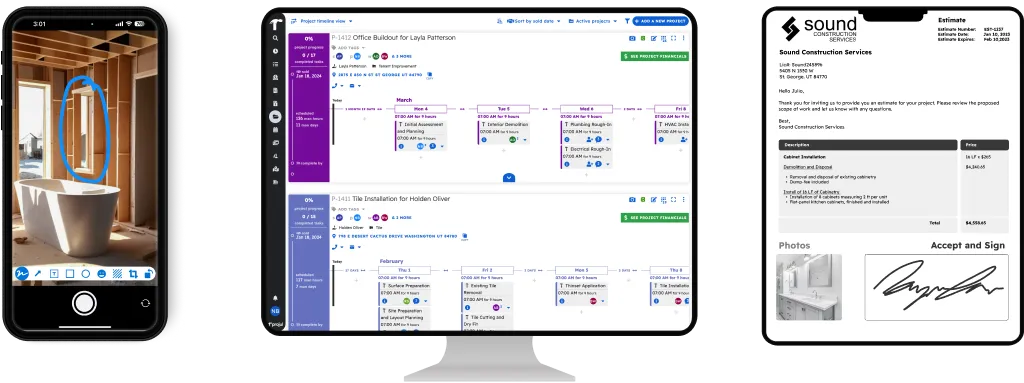
Construction Reporting Software That Tells You Where the Money Goes
Most contractors don’t have a reporting problem. They have a visibility problem. You know you’re busy. You know the crews are working. But at the end of the month, you look at the bank account and wonder where all the revenue went.
Projul’s construction reporting software generates profit, labor, sales pipeline, and estimator performance reports automatically from data your team enters daily. Contractors see which jobs make money and which advertising channels bring real results. Projul offers flat-rate pricing with no per-user fees for construction companies of all sizes.
Projul’s construction reporting software gives you the numbers you need to answer that question. Not in a spreadsheet you have to build yourself, but in reports that generate automatically from the data your team already enters every day. Contractors using Projul’s reporting tools see a 32% average profit increase, because you can’t fix what you can’t see.
Why Most Contractors Fly Blind on Their Numbers
Here’s the truth: most contractors don’t know their real numbers. They know their revenue. They know their big expenses. But the details in between? That’s where money disappears.
You don’t know which estimator has the best closing ratio. You don’t know which advertising channel actually brings in profitable work versus tire-kickers. You don’t know which project types make you the most money, and which ones you should stop bidding on.
And it’s not because you’re bad at business. It’s because pulling those numbers together manually is a nightmare. You’d need to cross-reference QuickBooks with your time tracking, your CRM, your project schedules, and probably three different spreadsheets. Nobody has time for that.
That’s what construction reporting software is supposed to solve. Not just showing you data, but showing you the right data without making you work for it.
Projul does this automatically. Every lead, every estimate, every time entry, every invoice, and every payment feeds into your reports. You don’t enter data twice. You don’t build formulas. You just open the report and see what’s happening.
The Report Types That Actually Matter
Not all reports are created equal. A report nobody reads is a waste of server space. Projul focuses on the reports that change how contractors run their businesses. Here’s what’s included and why each one matters.
Profitability Reports
This is the report most contractors wish they had but never built in a spreadsheet. Projul’s profitability reports show you how much money you actually made on each project after accounting for labor, materials, subs, and overhead.
You budgeted $45,000 for that kitchen remodel. The client paid $48,000. But did you actually make $3,000? Or did labor overruns and a material price increase eat your margin? Projul’s profitability report answers that question with real numbers.
When you can see profitability by project, you start noticing patterns. Maybe bathroom remodels consistently hit your target margin, but deck builds run 15% over on labor every time. That data helps you adjust your pricing, change your process, or stop bidding on work that doesn’t make you money.
Job Costing Reports
Job costing goes deeper than profitability. It breaks down costs by category within a project so you can see exactly where the money went.
Projul pulls data from budgeting, time tracking, and your material/sub expenses to build a complete picture:
- Labor costs by phase, by task, and by worker
- Material costs compared to your original estimate
- Subcontractor costs tracked against your budget
- Overhead allocation so you see the true cost, not just the direct expenses
The power of job costing is in the comparison. When you can see actual costs next to your budgeted costs for every line item, you know exactly where estimates are accurate and where they’re off. Over time, this data makes every future estimate better.
Time Reports
Your crew’s hours are one of your biggest expenses. Projul’s time reports give you full visibility into how those hours are spent.
See total hours by worker, by project, by task, or by date range. Identify which projects consume the most labor. Spot overtime trends before they become a payroll surprise. Compare crew efficiency across similar projects.
Time reports also serve as your payroll backup. When a worker disputes their hours or the DOL asks to see records, you’ve got digital timesheets with GPS verification ready to go.
Revenue Reports
Revenue reports show you the money coming in: invoiced amounts, collected payments, outstanding balances, and revenue by lead source.
This is how you answer questions like:
- How much revenue did we generate this quarter compared to last quarter?
- Which lead sources produce the highest-value projects?
- How much is sitting in outstanding invoices right now?
- What’s our average project value, and is it trending up or down?
Revenue data combined with cost data gives you your true profit picture. Projul connects both sides so you don’t have to build that view manually.
Sales and Estimator Performance Reports
Your sales process has a direct impact on your bottom line. Projul’s sales reports break down each estimator’s performance so you can see who’s closing deals and who needs coaching.
For each estimator, you get:
- Number of estimates sent. Are they staying busy or sitting on leads?
- Closing ratio. What percentage of their estimates turn into signed contracts?
- Revenue generated. How much business is each estimator bringing in?
- Average deal size. Are they going after the right-sized projects for your business?
This data turns sales management from a gut-feeling exercise into a numbers-driven process. When you can show an underperforming estimator exactly where they’re falling behind, the coaching conversation is based on facts, not opinions.
Advertising ROI Reports
Every contractor spends money on marketing, but most have no idea which channels actually produce paying clients versus tire-kickers.
Projul tracks lead sources and ties them to closed deals. That means you can see:
- Which advertising channels bring in the most revenue (not just the most leads)
- Cost per acquisition by channel
- Revenue by zip code so you can target your best-performing areas
- Which lead sources produce the highest-quality projects
This report alone can save you thousands per year in wasted ad spend. When you can see that Google Ads brings in $200,000 in revenue while that magazine ad produces nothing, the budget decision makes itself.
Custom Reports for Unique Needs
Every contractor’s business is a little different. The standard reports cover what most contractors need, but sometimes you need data in a specific format or a view that doesn’t exist out of the box.
Projul’s team will work with you to build custom reports when the standard options don’t cover your situation. A GC who needs to submit weekly progress reports to an owner in a specific format? Projul can build that. A commercial contractor who needs to break down costs by CSI division? That’s possible too.
This is part of Projul’s customer-driven development approach. If you need a report that helps you run your business better, tell the team and they’ll figure out how to make it happen.
Real-Time Data, Not Last Month’s Numbers
The biggest problem with spreadsheets and manual reporting is that your numbers are always stale. By the time you finish the report, it’s already out of date.
Projul’s reports pull live data. When your crew logs time this morning, it shows up in your labor reports today. When an estimator closes a deal, your sales numbers update instantly. You’re making decisions based on what’s happening now, not what happened three weeks ago.
This matters more than most contractors realize. If a project is running over budget on labor, you want to know on day 10, not day 30. If a lead source stopped producing quality leads last month, you want to shift your ad spend before you waste another month’s budget.
Real-time data turns reporting from a backward-looking exercise into a forward-looking management tool. You’re not just reviewing what happened. You’re using current data to make better decisions right now.
Export Capabilities: Get Data Where It Needs to Go
Reports are only useful if you can do something with them. Projul lets you export report data so it flows into whatever systems you use.
QuickBooks export. Time tracking data and financial reports export directly to QuickBooks so your accountant works with the same numbers you see in Projul. No discrepancies, no double entry.
CSV export. Need to pull data into Excel for a custom analysis? Export any report to CSV and work with it however you want. Your bookkeeper, your accountant, and your business partner can all get the data in a format they’re comfortable with.
Client-facing reports. Some reports are meant for your clients, not just your team. Progress reports, cost summaries, and project status updates can be shared through Projul’s client portal so your clients stay informed without calling your office.
The goal is to make sure data doesn’t get stuck inside Projul. It flows to your accounting system, your payroll processor, your clients, and anyone else who needs to see it.
Data-Driven Decision Making for Contractors
“Data-driven” sounds like a buzzword, but for contractors it means something very practical: making decisions based on actual numbers instead of gut feelings.
Here’s what that looks like in real life:
Pricing decisions. Your job costing reports show that deck builds consistently run 12% over your labor estimates. Instead of losing money on the next deck, you increase your labor estimate by 12% and protect your margin.
Marketing decisions. Your advertising ROI report shows that Angi leads close at 8% while Google Ads leads close at 22%. You shift your budget to Google Ads and get more revenue per dollar spent.
Hiring decisions. Your time reports show that your crews are consistently working 50+ hour weeks across every project. That overtime is killing your margins. Time to hire another crew instead of paying overtime.
Client decisions. Your revenue reports show that one client consistently pays late and generates the most change order disputes. You can decide whether that relationship is worth the headache.
None of these decisions require a business degree or an analyst. They just require data, and Projul gives you that data automatically from the work your team is already doing.
Track Your Costs Before They Get Away From You
Projul ties live construction costs directly into your reports. Material costs, labor hours, sub invoices, and overhead all show up in real time against your budget.
This is how you stop the slow bleed that kills contractor profits. You know your budget for a job. Projul shows you exactly where you stand against that budget at any point during the project. When labor is running 15% over on a specific task, you see it before it becomes 30% over.
And because Projul integrates with QuickBooks, your financial reports are built from the same data your accountant uses. No discrepancies between what Projul shows and what QuickBooks shows.
Reporting That Runs Itself
You don’t need to set anything up. Projul generates reports automatically from the data your team enters during normal work. Log time, update tasks, close leads, send invoices. All of that data feeds into your reports without any extra steps.
The more you use Projul, the better your reports get. After a few months, you’ve got historical data that shows trends. Which months are your busiest? Which project types are most profitable? Which marketing channels have the best ROI over time?
That kind of data is worth serious money. It’s the difference between guessing and knowing. And it doesn’t cost you a minute of extra effort because the data comes from work your team is already doing.
Prospect reports, lead source reports, estimator reports, sales reports, time tracking reports, project reports, and more. All included, all automatic.
Need a custom report? Just ask the Projul team.
Why Most Contractors Fly Blind (And How Reports Fix That)
Let’s be honest for a second. If someone asked you right now, “What’s your net profit margin on bathroom remodels versus kitchen remodels?” - could you answer? What about, “Which of your three estimators brings in the most profitable work?” Or, “What’s your average cost per lead from Google Ads, and how does that compare to what you spend on yard signs?”
Most contractors can’t answer those questions. Not because they’re bad at running a business, but because the information lives in six different places and nobody has time to pull it together.
Here’s the thing: you probably know if you’re busy. Your phone rings, crews are booked out, trucks are rolling every morning. Busy feels good. Busy feels like success. But busy and profitable are two very different things, and the gap between them is where most contractors get hurt.
The $250K Gap You Don’t Know About
Picture two roofing companies. Both do $2 million in annual revenue. Both have six crews, a small office staff, and a fleet of trucks. From the outside, they look identical.
Company A nets $50,000 at the end of the year. The owner takes home less than some of his crew leads. He’s working 60-hour weeks, stressed about payroll every Friday, and wondering why the bank account never seems to grow.
Company B nets $300,000. The owner works a 45-hour week, takes a real vacation in January, and has cash reserves for slow months.
What’s the difference? It’s not that Company B has better crews or nicer trucks. It’s that Company B knows their numbers. They know which project types make money and which don’t. They know which marketing channels bring in profitable clients. They know when labor is running over budget on a job - while there’s still time to course-correct.
Company A runs on gut feeling. Company B runs on data. That’s a $250,000 difference.
Gut Feeling Is Not a Business Strategy
Every contractor has gut feelings about their business. You “feel like” Google Ads works better than Angi. You “think” your senior estimator closes more deals. You’re “pretty sure” commercial work is more profitable than residential.
But gut feelings are wrong more often than you’d expect. That estimator who “feels” like your top closer might have the highest volume but the lowest margin. That marketing channel that “seems” expensive might actually produce your most profitable clients. That project type you love bidding on might be the one that’s slowly bleeding your margins.
The contractors who make the jump from surviving to thriving are the ones who replace gut feelings with actual numbers. And the good news is that you don’t need an MBA or a data analyst to do it. You just need reporting software that builds those reports automatically from the work you’re already doing.
That’s what Projul does. Every time your team logs hours, updates a task, closes a lead, or sends an invoice, that data feeds into reports you can actually use. No spreadsheets. No formulas. No weekend data entry sessions. Just open the report and see the truth about your business.
What “Knowing Your Numbers” Actually Looks Like
Knowing your numbers doesn’t mean staring at spreadsheets all day. It means having answers ready when the questions come up. Questions like:
- “Should we bid on this type of work?” Your profitability reports show that additions consistently hit 25% margin while decks barely break 10%. Now you know where to focus.
- “Should we hire another crew or keep paying overtime?” Your time reports show 200 hours of overtime last month across all crews. At time-and-a-half, that overtime costs more than adding a crew member.
- “Is this marketing channel worth it?” Your advertising ROI report shows that HomeAdvisor leads cost $180 each and close at 5%. Google Ads leads cost $90 each and close at 18%. The math does itself.
- “Why did we have a great revenue month but the bank account didn’t grow?” Your accounts receivable report shows $180,000 in unpaid invoices over 60 days. Revenue happened. Collection didn’t.
These aren’t hypothetical scenarios. These are real decisions that contractors face every week. And the difference between guessing and knowing is the difference between a business that grows and one that stays stuck.
The Cost of Not Knowing
Flying blind has a real dollar cost, even if you never see a line item for it. It shows up as:
- Underbid jobs where you estimated 200 labor hours and the crew spent 280. That’s 80 hours of labor you ate because your estimates were based on feel instead of historical data.
- Wasted ad spend on channels that bring in leads but not paying clients. If you’re spending $2,000 a month on a lead source that produces zero closed jobs, that’s $24,000 a year gone.
- Slow-paying clients who tie up your cash flow because nobody tracks accounts receivable aging. That $50,000 sitting in 90-day invoices is money you earned but can’t spend.
- Underperforming estimators who send out proposals but never follow up. If your closing ratio is 15% when it should be 25%, you’re leaving hundreds of thousands on the table.
None of these problems announce themselves. They hide in the gaps between your systems. Reports are how you find them, and finding them is the first step to fixing them.
Reports Every Construction Company Should Run Monthly
You don’t need 50 reports cluttering your screen. You need five or six that tell you exactly how your business is performing - and more importantly, what to do about it.
Here are the reports every construction company should be running at least once a month. Skip any of these and you’re making decisions with incomplete information.
Job Profitability: Estimated vs Actual
This is the single most important report in your business. For every job, it compares what you estimated (labor, materials, subs, overhead) against what you actually spent.
What it tells you: Which jobs made money and which didn’t. Not in vague terms - in exact dollars. You estimated $12,000 in labor for that bathroom remodel and spent $15,800. That $3,800 overrun turned a profitable job into a break-even job.
What to do about it: Look for patterns. If labor overruns happen on the same type of work, your estimates are off for that category. Adjust your templates. If overruns follow a specific crew, it might be a productivity or supervision issue. If material costs keep coming in high, your supplier pricing might be stale.
Projul connects your budgeting data directly to live construction costs so this comparison happens automatically. You don’t need to export from one system and import to another. The estimated column comes from your budget. The actual column comes from time entries, material receipts, and sub invoices your team logs during the job.
Over time, this report makes your estimating more accurate. After six months of data, you’ll know exactly how many labor hours a 200-square-foot deck actually takes - not how many you think it takes, but how many it actually takes based on completed projects. That accuracy is worth thousands of dollars per year in better estimates.
Lead Source ROI
You spend money to get leads. This report tells you whether that money comes back.
What it tells you: For every lead source (Google Ads, Angi, yard signs, referrals, your website, Facebook, whatever), you see how many leads came in, how many turned into estimates, how many closed, the total revenue from closed deals, and your cost per acquisition.
What to do about it: Cut the channels that cost more than they return. Double down on the ones that produce profitable work. And pay attention to the word “profitable” - a lead source that brings in high volume but low-margin work is worse than one that brings in fewer leads at higher margins.
This report also helps you catch trends. Maybe Google Ads worked great last year but performance has dropped over the last three months. Without the report, you wouldn’t notice until you’d wasted another quarter of ad spend.
The key here is that Projul tracks lead source all the way through the pipeline - from first contact to closed deal to final invoice. Most CRMs track leads. Most accounting tools track revenue. Projul connects the two so you can see the full picture.
Revenue by Project Type
Not all work is created equal. This report breaks down your revenue (and ideally, your profit) by the type of work you do.
What it tells you: Which categories of work generate the most revenue and which are most profitable. These aren’t always the same thing. You might do $800,000 in kitchen remodels but only net 8% on them, while your $200,000 in bathroom work nets 22%.
What to do about it: Shift your marketing and bidding toward your most profitable project types. This doesn’t mean you stop doing other work entirely, but it means you make conscious decisions about your mix instead of just taking whatever comes through the door.
Some contractors discover that a project type they’ve been chasing for years is actually their least profitable category. That’s painful to learn, but it’s a lot less painful than spending another five years losing money on it.
Accounts Receivable Aging
Cash flow kills more contractors than bad estimates. This report shows you every unpaid invoice, grouped by how long it’s been outstanding: current, 30 days, 60 days, 90+ days.
What it tells you: How much money is owed to you and how long it’s been sitting there. A healthy business has most of its receivables in the “current” or “under 30 days” bucket. If you’ve got $100,000 in the 60+ day column, you have a collection problem.
What to do about it: Set up a follow-up process for aging invoices. Call at 30 days. Send a formal notice at 45 days. Escalate at 60 days. The longer an invoice sits, the less likely it gets paid - studies show that invoices over 90 days old have less than a 50% collection rate.
This report also helps you identify problem clients before you do more work for them. If a client has a history of slow payment, you can require deposits or progress payments on future jobs instead of getting burned again.
Crew Productivity
Your crews are your biggest asset and your biggest expense. This report shows you how productive each crew is relative to the work they’re completing.
What it tells you: Hours worked versus tasks completed, by crew and by project. Which crews consistently finish ahead of schedule? Which ones run over? Are there specific task types where certain crews excel or struggle?
What to do about it: Assign work based on data instead of habit. If Crew A finishes framing 20% faster than Crew B, put Crew A on the jobs where framing is the critical path. Use the data to set realistic schedules instead of optimistic ones. Identify training opportunities for underperforming crews.
Productivity data also helps with hiring decisions. If all your crews are running at 95% capacity with regular overtime, that’s a clear signal to hire. If one crew is at 70% while others are at 95%, you might have a scheduling or management issue instead of a staffing issue.
Bonus: Run These Reports Together
The real power shows up when you look at multiple reports side by side. Job profitability tells you which jobs lost money. Time reports tell you why (labor overruns). Lead source ROI tells you where those jobs came from. Put it all together and you might find that leads from a specific source consistently turn into unprofitable work - something you’d never catch by looking at any single report alone.
This cross-report insight is where contractors go from managing their business to actually understanding it. And once you understand it, you can start making changes that compound over time. Better estimates lead to better margins. Better marketing spend leads to more profitable clients. Better crew assignment leads to lower labor costs. Each improvement feeds the next one.
Real-Time Dashboards vs End-of-Year Surprises
There are two ways to find out you lost money on a job. The first way is in real time, while the project is still active, when you can actually do something about it. The second way is at tax time, six months later, when your accountant hands you a P&L statement and you stare at numbers you can’t change.
Most contractors experience the second way. And it’s brutal.
The Tax-Time Gut Punch
Here’s a scene that plays out in thousands of contractor offices every spring. You sit down with your accountant. They show you the annual numbers. Revenue was up - great. But net profit? Flat. Or worse, down.
You start digging. Turns out 40% of your jobs last year actually lost money when you factor in all the costs. Not huge losses on any single job - a few thousand here, a few thousand there. But across 50 or 60 jobs, those small losses add up to six figures.
And the worst part? You can’t go back and fix any of it. Those jobs are done. The invoices are paid (or written off). The crew hours are logged. The only thing you can do is promise yourself you’ll “pay more attention” next year. But without a system to catch problems in real time, the same thing happens again.
What Real-Time Dashboards Change
A dashboard that shows today’s numbers - not last quarter’s, not last month’s, but today’s - changes the game completely. Here’s what it looks like in practice.
Monday morning. You open Projul and check your active project dashboard. You’ve got 12 jobs running. Ten are on track. Two are yellow - labor is running 10% over budget. You click into one and see that the tile crew has spent 30% more hours than estimated on a bathroom floor. The job still has two weeks left. You call the crew lead, find out the subfloor had issues nobody reported, and adjust the remaining schedule. Problem caught. Margin saved.
Without the dashboard, that 30% labor overrun keeps growing. By the time the job is done, it’s 50% over. By the time you see it in your quarterly numbers, it’s just another job that “didn’t quite hit the margin.”
Wednesday afternoon. Your sales dashboard shows that your newest estimator has sent 15 proposals this month but closed zero. Your senior estimator has sent 8 and closed 5. You pull the new estimator aside for a coaching session, review their proposals together, and find out they’re consistently pricing 20% higher than your standard rates because they’re not using your templates. Fixed in one conversation.
Without the dashboard, that estimator keeps sending overpriced proposals for months. You lose 15 potential clients you could have closed. You assume the market is slow. It’s not - your process is broken.
Friday end of day. Your cash flow view shows that accounts receivable just crossed $200,000, with $80,000 in the 60+ day bucket. You flag the three biggest overdue invoices for your office manager to follow up on Monday morning. Two of them pay within a week.
Without the dashboard, that $80,000 sits there until someone manually runs an aging report - which might be next month, or might be never.
The Difference Between Backward-Looking and Forward-Looking
Traditional reporting is backward-looking. You run a report at the end of the month, the end of the quarter, or the end of the year. You review what happened. You feel good about some things and bad about others. Then you close the report and go back to running the business the same way.
Real-time dashboards are forward-looking. Yes, they show you historical data. But more importantly, they show you what’s happening right now - which means you can change what happens next.
A monthly profitability report tells you that Job #4523 lost $8,000. That’s useful for future pricing, but the money’s gone.
A real-time dashboard tells you that Job #4523 is currently $3,000 over budget on labor with three weeks of work remaining. That’s useful right now because you can adjust staffing, talk to the crew, or renegotiate scope before it becomes $8,000.
This is the fundamental shift that Projul’s reporting brings to your business. You stop being surprised by your numbers and start managing them. Your job management system feeds data into your dashboards every day, so you always know where you stand.
How Much Is a Week of Visibility Worth?
Think about this: if catching a labor overrun one week earlier saves you $2,000 on a single job, and you catch three of those per month, that’s $6,000 a month - $72,000 a year. That’s not theoretical. That’s what happens when you see problems while they’re still small enough to fix.
Now add in the savings from cutting underperforming ad channels sooner, collecting overdue invoices faster, and coaching estimators before they lose a quarter’s worth of deals. The compounding effect of real-time visibility is enormous.
Contractors who switch from end-of-year spreadsheet reviews to real-time dashboards consistently say the same thing: “I can’t believe I ran my business without this.” Once you see your numbers in real time, going back to guessing feels reckless.
You Don’t Have to Check Every Day
Real-time doesn’t mean you need to stare at a dashboard 24/7. It means the data is there when you need it. Check in Monday morning to plan your week. Glance at it Wednesday to see if anything needs attention. Review it Friday to know where things stand going into the weekend.
The dashboard is always current. Whether you look at it once a day or once a week, the numbers reflect reality - not a snapshot from three weeks ago. That’s the difference between managing your business and hoping it works out.
How Projul Reports Help You Make Better Decisions
Data is only useful if it leads to action. The best reporting software in the world doesn’t matter if you look at the numbers and think, “Cool, now what?” Projul’s reports are designed to answer specific business questions - the ones that keep you up at night.
Which Marketing Channels Bring Profitable Clients?
There’s a difference between a marketing channel that brings in leads and one that brings in profitable clients. Most marketing dashboards track lead volume and cost per lead. That’s fine as far as it goes, but it misses the most important part: what happens after the lead becomes a client.
Projul tracks the full journey. A lead comes in from Google Ads. Your estimator sends a proposal. The client signs. Your crew does the work. You invoice. You get paid. Projul connects all of those steps so you can trace revenue (and profit) back to the original lead source.
This changes everything about how you spend your marketing budget. Instead of asking, “Which channel brings the most leads?” you ask, “Which channel brings the most profitable work?” Those are very different questions with very different answers.
Maybe your Facebook ads bring in 40 leads a month, but they’re mostly small repair jobs that average $1,500 and net 8%. Meanwhile, your CRM shows that Google Ads brings in 15 leads a month, but they’re remodel projects that average $35,000 and net 20%. The Facebook leads feel busier. The Google Ads leads make you money.
Without this data, you’d probably keep splitting your budget evenly. With it, you shift dollars to what works and stop wasting money on what doesn’t.
Which Project Types Make the Most Money?
This seems like a simple question, but most contractors get it wrong because they confuse revenue with profit. A project type that generates a lot of revenue but has thin margins might be worse for your business than a smaller category with fat margins.
Projul’s reports break down both revenue and profitability by project type so you can see the full picture. Maybe commercial tenant improvements bring in $500,000 a year but only net 5% after all the administrative overhead, compliance requirements, and slow payment cycles. Meanwhile, residential bathroom remodels bring in $300,000 but net 22% with fewer headaches.
Which one would you rather do more of? The answer might surprise you, and it might be different from what your gut says.
This data also helps with strategic planning. If you want to grow revenue by $500,000 next year, your reports tell you which project types can deliver that growth most profitably. Instead of taking everything that comes through the door, you make intentional choices about the work you pursue.
Which Crews Are Most Productive?
Labor is your biggest variable cost. Small differences in crew productivity compound into huge differences in profitability across a year’s worth of projects.
Projul’s time tracking data feeds directly into productivity reports that show you how each crew performs against estimated hours, by project type and by task. You might find that Crew A consistently finishes rough carpentry 15% under budget while Crew B runs 10% over. Over 50 projects, that 25-percentage-point gap represents hundreds of hours of labor - tens of thousands of dollars.
This isn’t about punishing the slower crew. It’s about understanding where the differences come from and making better decisions. Maybe Crew B runs over because they get assigned the trickiest projects. Maybe they need different equipment. Maybe they need a more experienced lead. The data tells you where to look. The solution comes from a conversation, not a spreadsheet.
Productivity data also helps you bid more accurately. Instead of estimating labor based on an average across all crews, you can estimate based on the crew you plan to assign. That precision makes your bids tighter and your margins more predictable.
Where’s Your Cash Flow Bottleneck?
Cash flow problems rarely come from a single source. They’re usually a combination of factors: slow-paying clients, front-loaded material costs, gaps between project phases, and seasonal revenue dips. Projul’s reports help you identify which factor is hurting you the most right now.
Your accounts receivable aging report shows whether slow collection is the issue. Your project timeline view shows whether gaps between jobs are creating revenue droughts. Your cost reports show whether you’re paying for materials and subs long before client payments arrive.
Once you identify the bottleneck, you can address it directly. If slow collection is the problem, tighten your payment terms and follow up faster. If front-loaded costs are the issue, restructure your billing to collect deposits and progress payments. If seasonal dips are killing you, build a cash reserve during your busy months.
The point is that “cash flow is tight” stops being a vague complaint and becomes a specific, addressable problem. Projul gives you the data to diagnose it. You decide how to fix it.
Replacing Guesses with Decisions
Every one of these questions - marketing ROI, project profitability, crew productivity, cash flow - has a gut-feeling answer and a data-driven answer. The gut-feeling answer might be right sometimes. The data-driven answer is right every time (as long as your data is accurate, which it is when your team uses Projul daily).
The shift from guessing to knowing doesn’t happen overnight. It starts with running a few reports, noticing something you didn’t expect, and making one change based on what the data shows. Then you see the result of that change in next month’s numbers. That builds confidence. You make another data-driven decision. And another.
Within a few months, you’re running your business differently. Not because you read a business book or hired a consultant, but because you can finally see what’s actually happening in your company. The numbers were always there - Projul just makes them visible.
And that visibility is the difference between a contractor who works hard and one who works hard and gets paid for it.
Reports That Connect Your Whole Business
Projul’s reports pull data from budgeting and time tracking so you can see labor costs, material spend, and profit margins across every job. Spot problems early instead of finding out at the end of the project.
See how your invoicing and CRM are performing with reports that show closing rates, outstanding invoices, and revenue by lead source. The numbers you need to make smart decisions are all in one place.
Over 5,000 contractors rely on Projul’s reporting tools to run their businesses by the numbers. Plans start at $399/month with no per-user fees, so your whole team contributes data and everyone benefits from the reports.
Stop guessing. Start knowing.


